Opportunity Monitor Zurich
Background
Where you grow up should not determine your economic future, yet it often does. The University of Zurich’s Institute of Political Science conducted extensive research on intergenerational income mobility across the Canton of Zurich and revealed differences between neighborhoods, with children’s chances of matching or surpassing their parents’ income levels varying substantially across districts.
These findings provide essential insight into social equity but remained largely confined to academic publications. Superdot Studio collaborated with the research team to translate this complex research into an accessible digital platform for public understanding.
Challenge
Social mobility is inherently difficult to communicate visually. Conventional statistical charts show correlations but fail to reveal how income groups move across generations or how mobility differs between neighborhoods.
The platform also needed to serve multiple audiences. Researchers require methodological clarity and precision. Policymakers rely on credible evidence for decision making. Citizens seek understandable insights into their local environment. The central challenge was to combine scientific accuracy with a visual language and navigation structure that makes opportunity structures immediately recognizable and comparable.
Idea
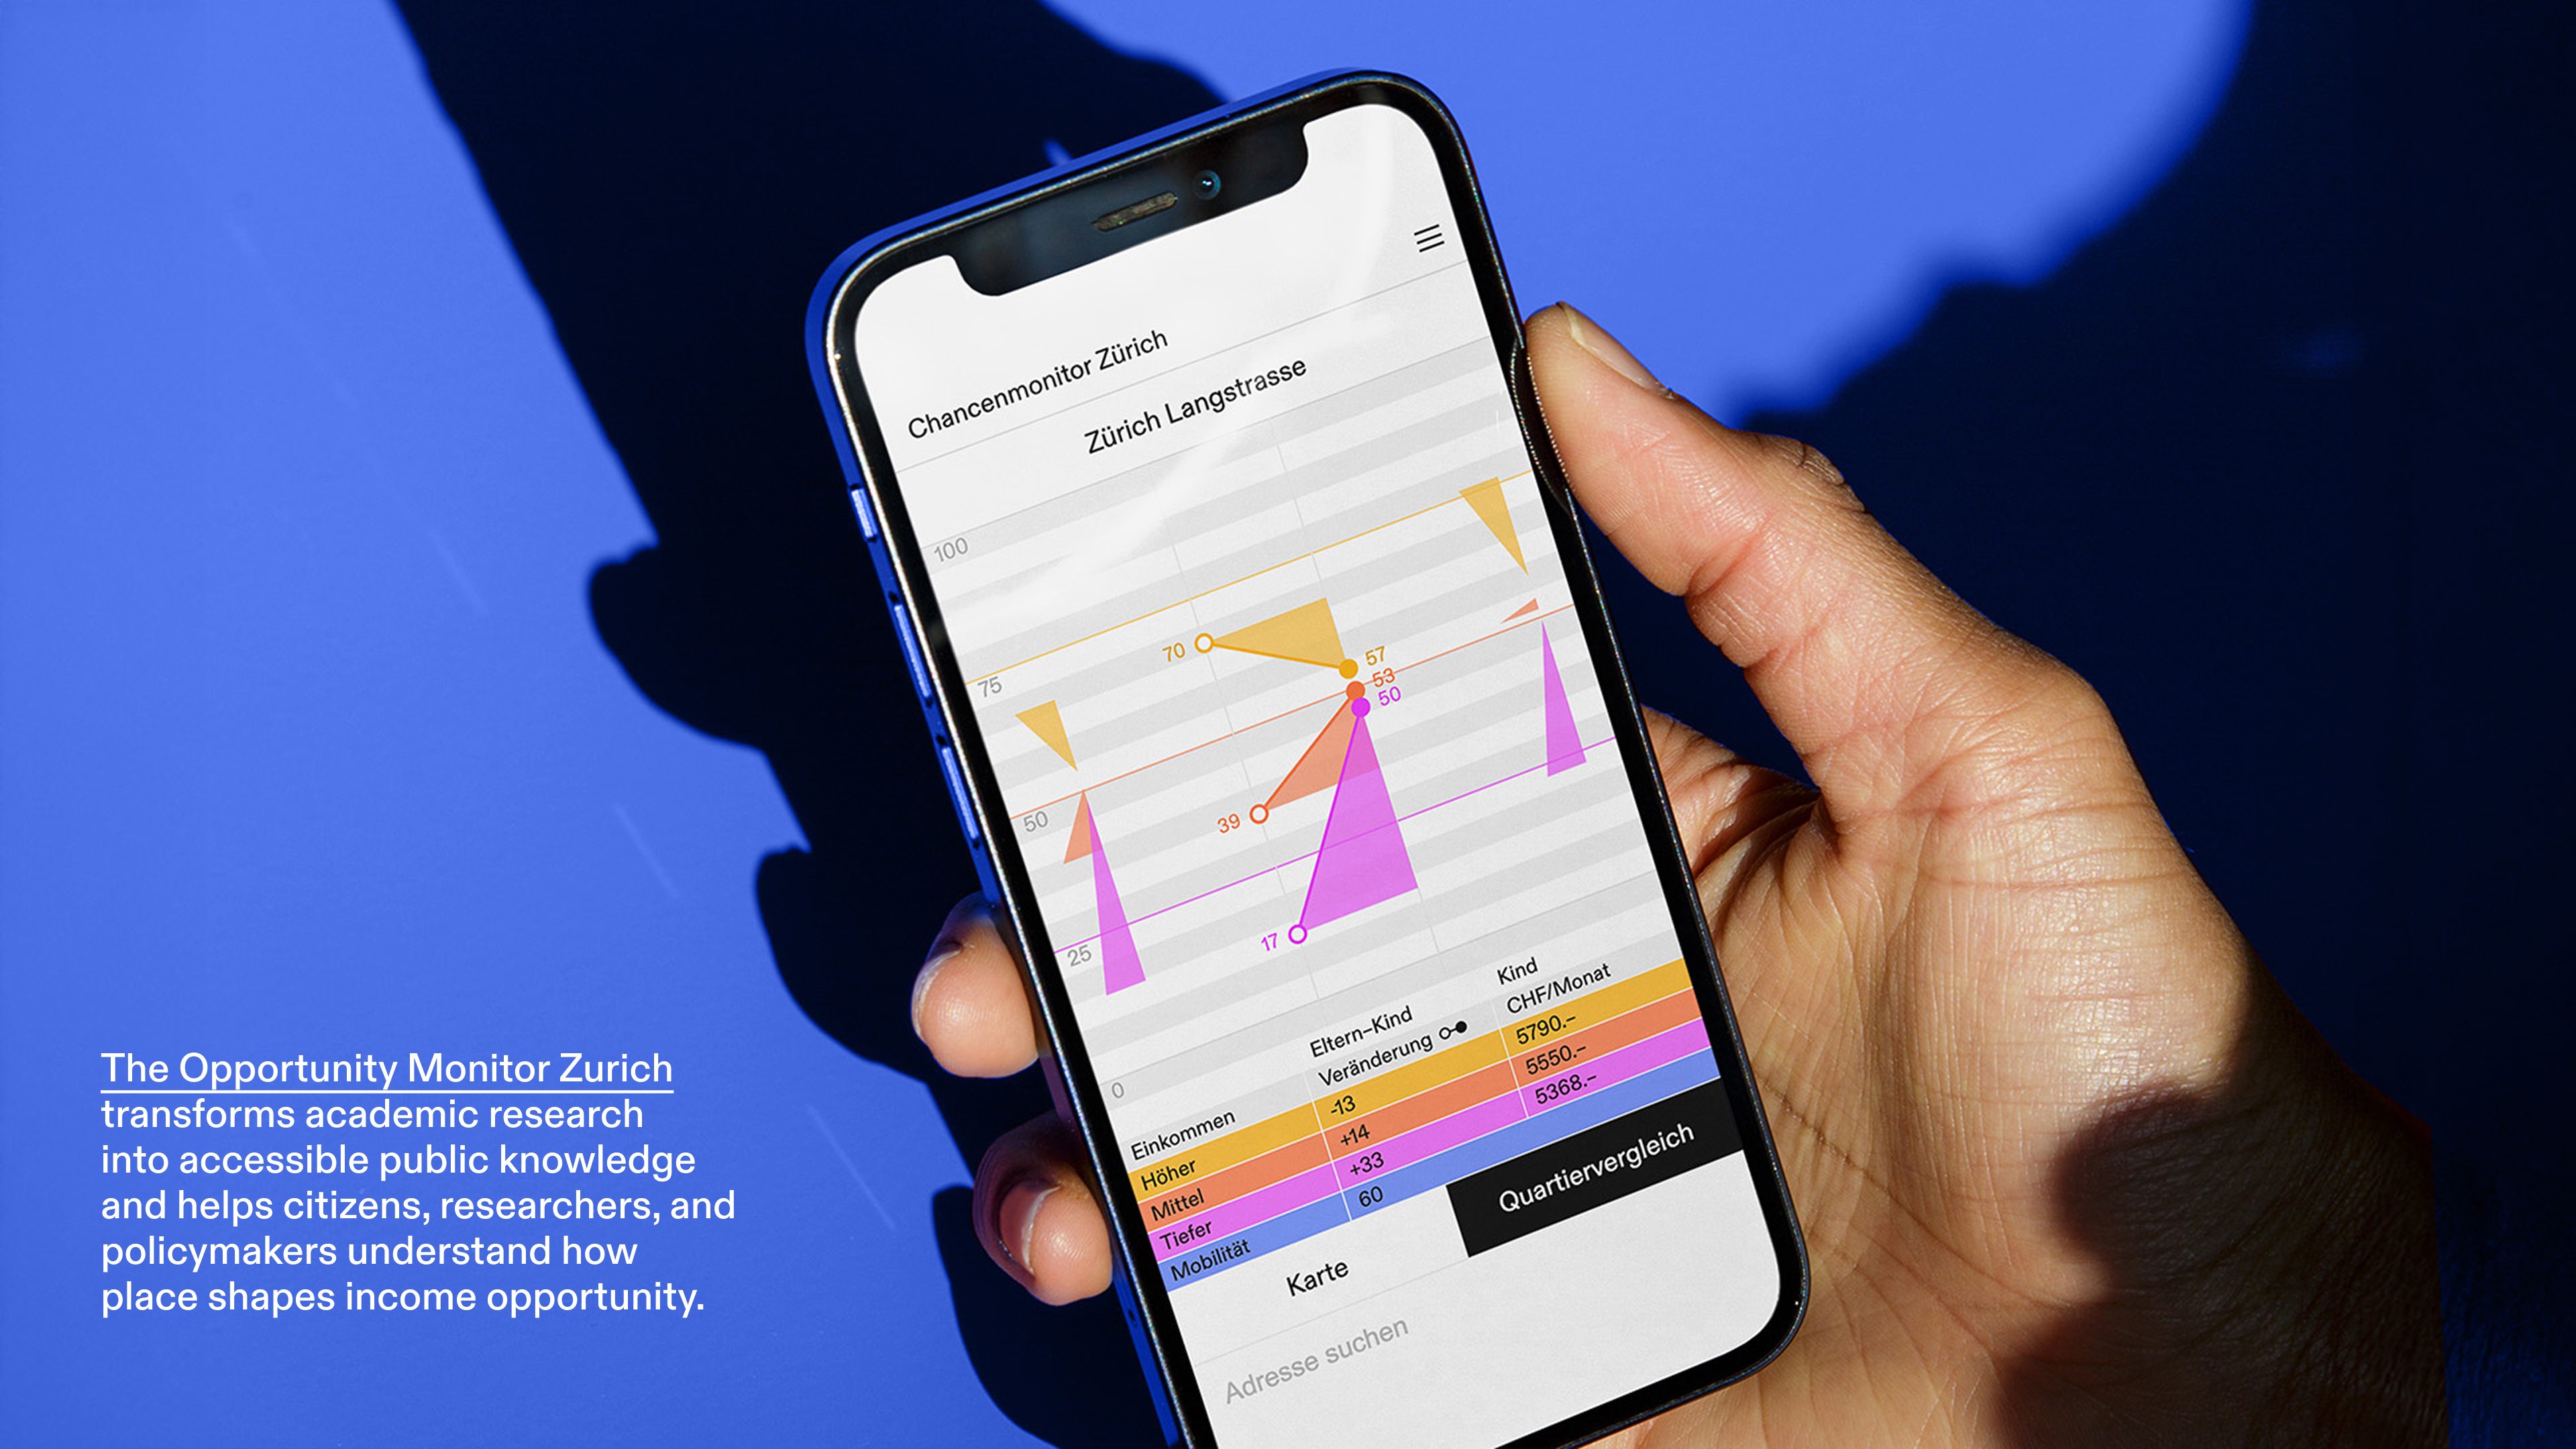
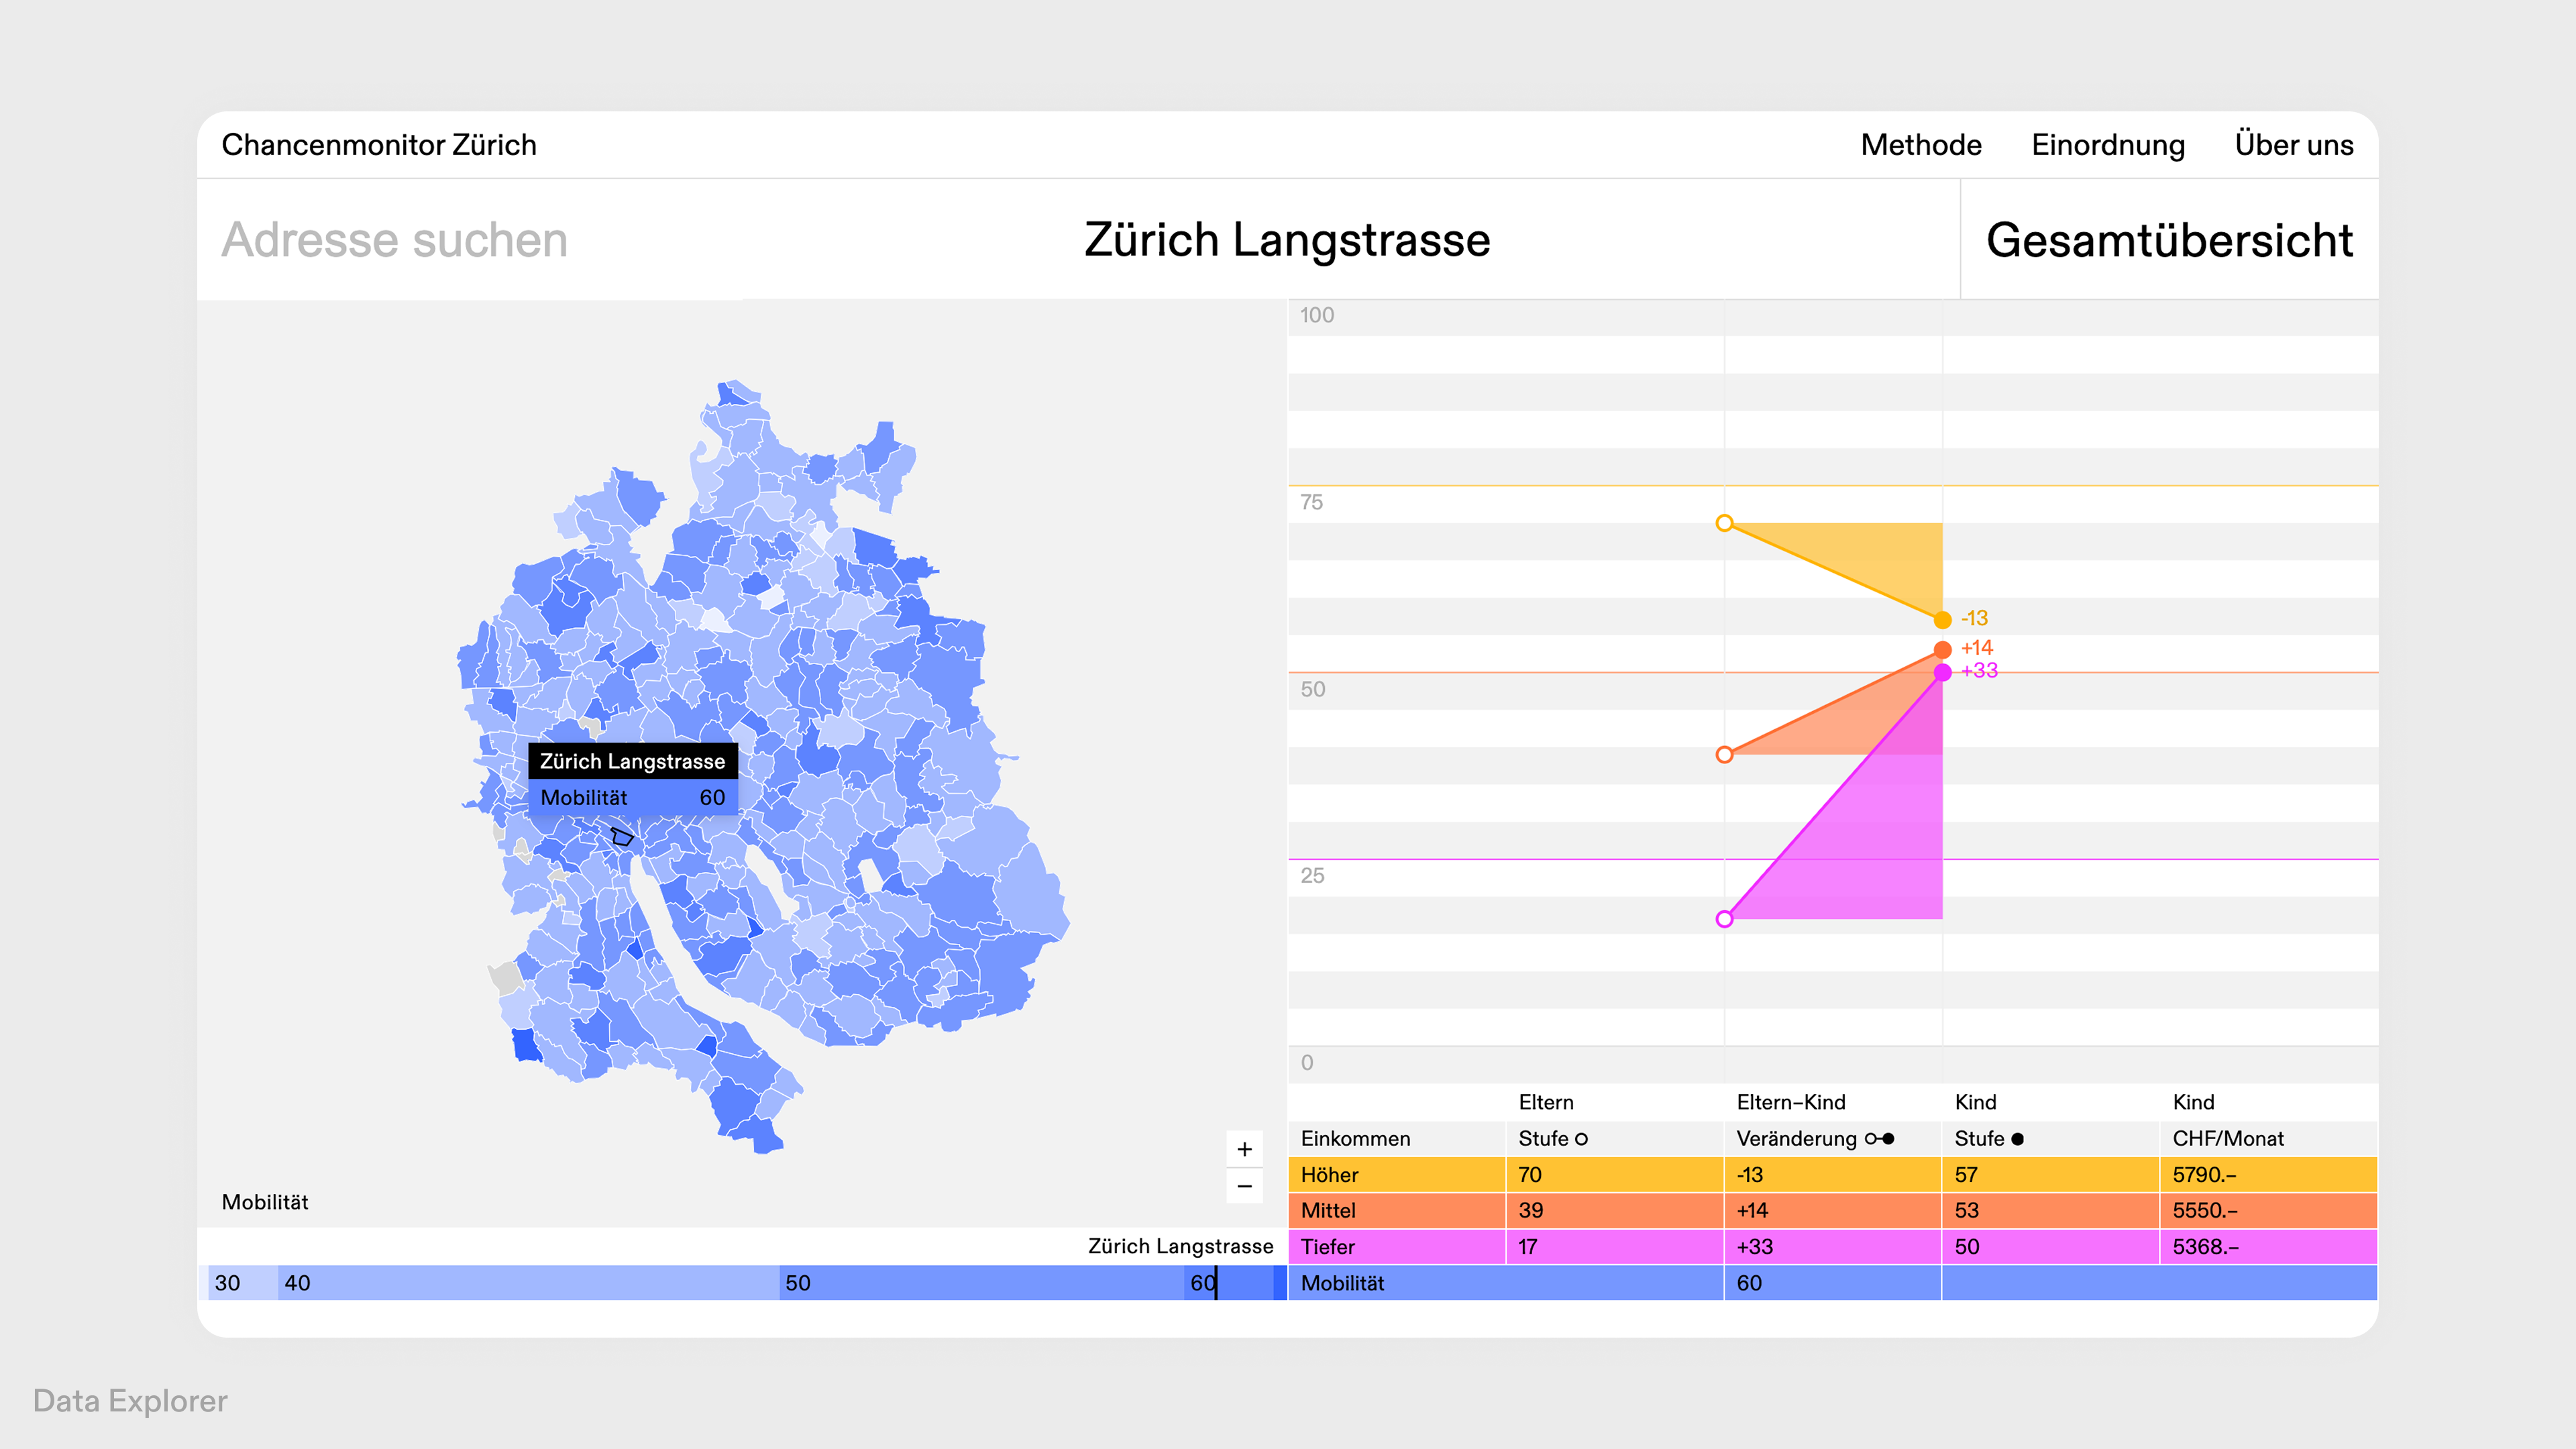
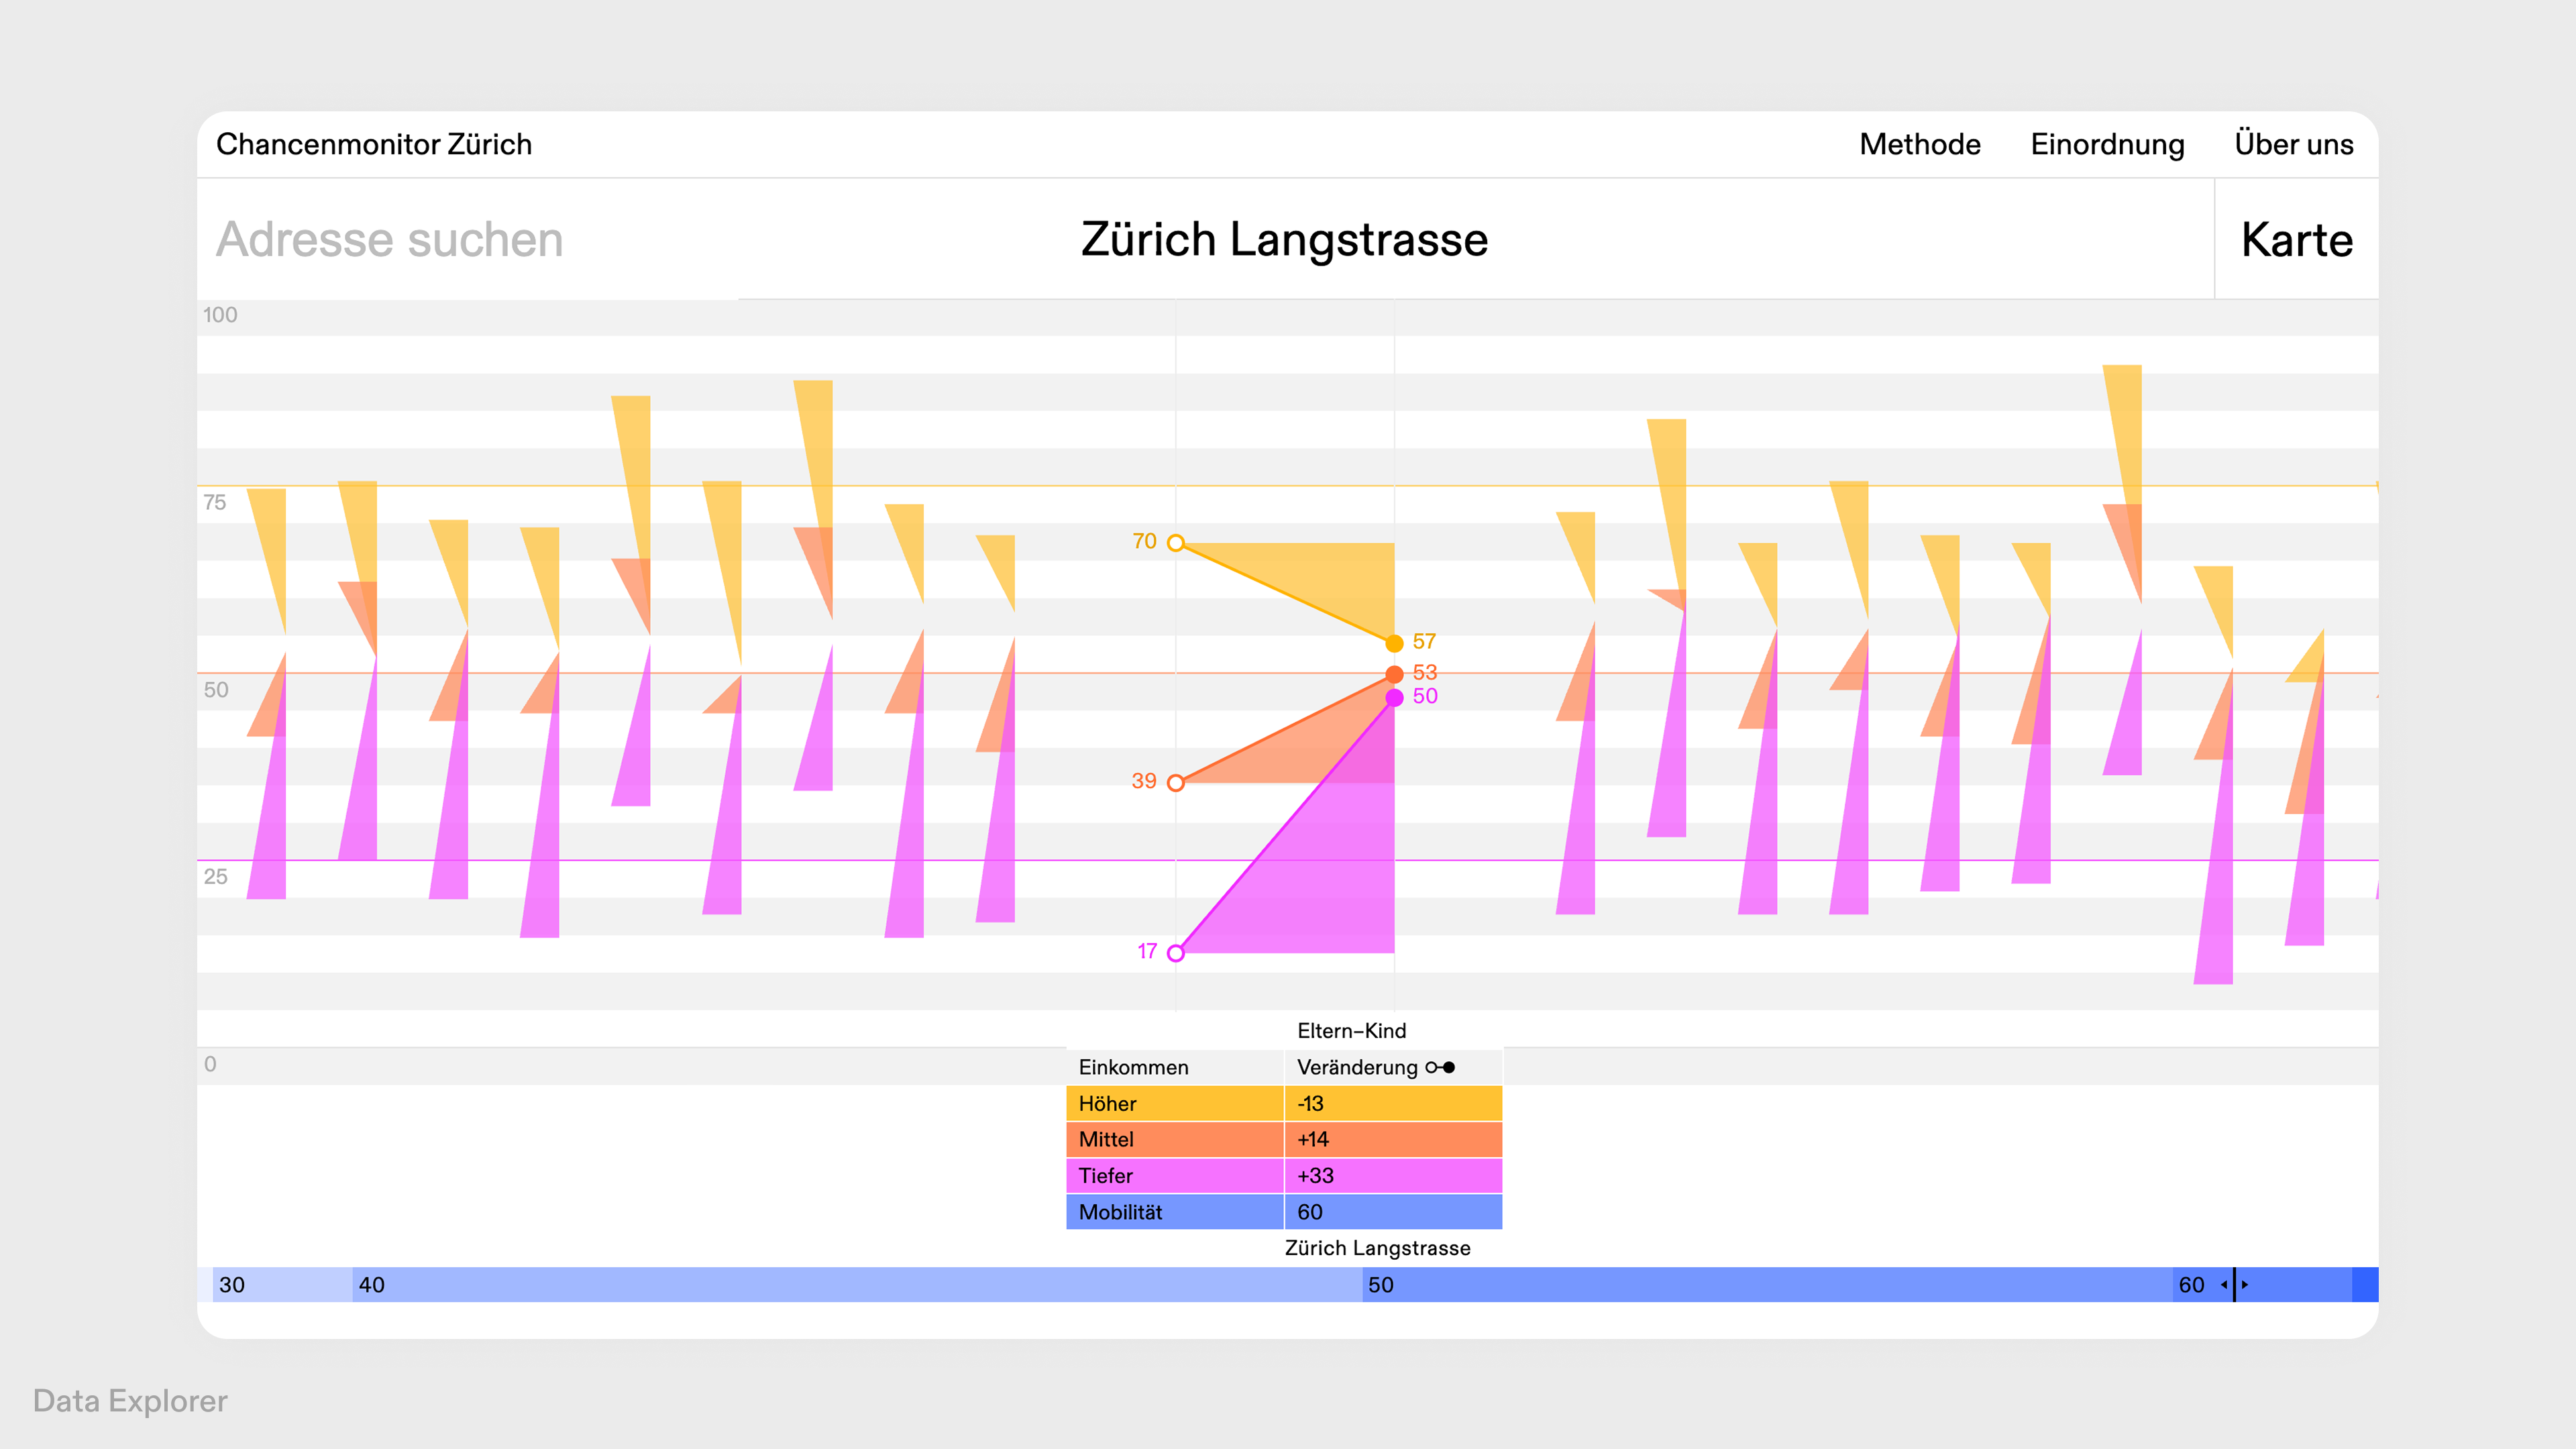
Superdot developed the Multigeneration Slope Diagram, a chart type that translates statistical relationships into visible movement. Colored triangular shapes represent children from low, middle, and high income families and visualize their economic starting points and outcomes as adults, while distance and direction reveal upward or downward mobility.
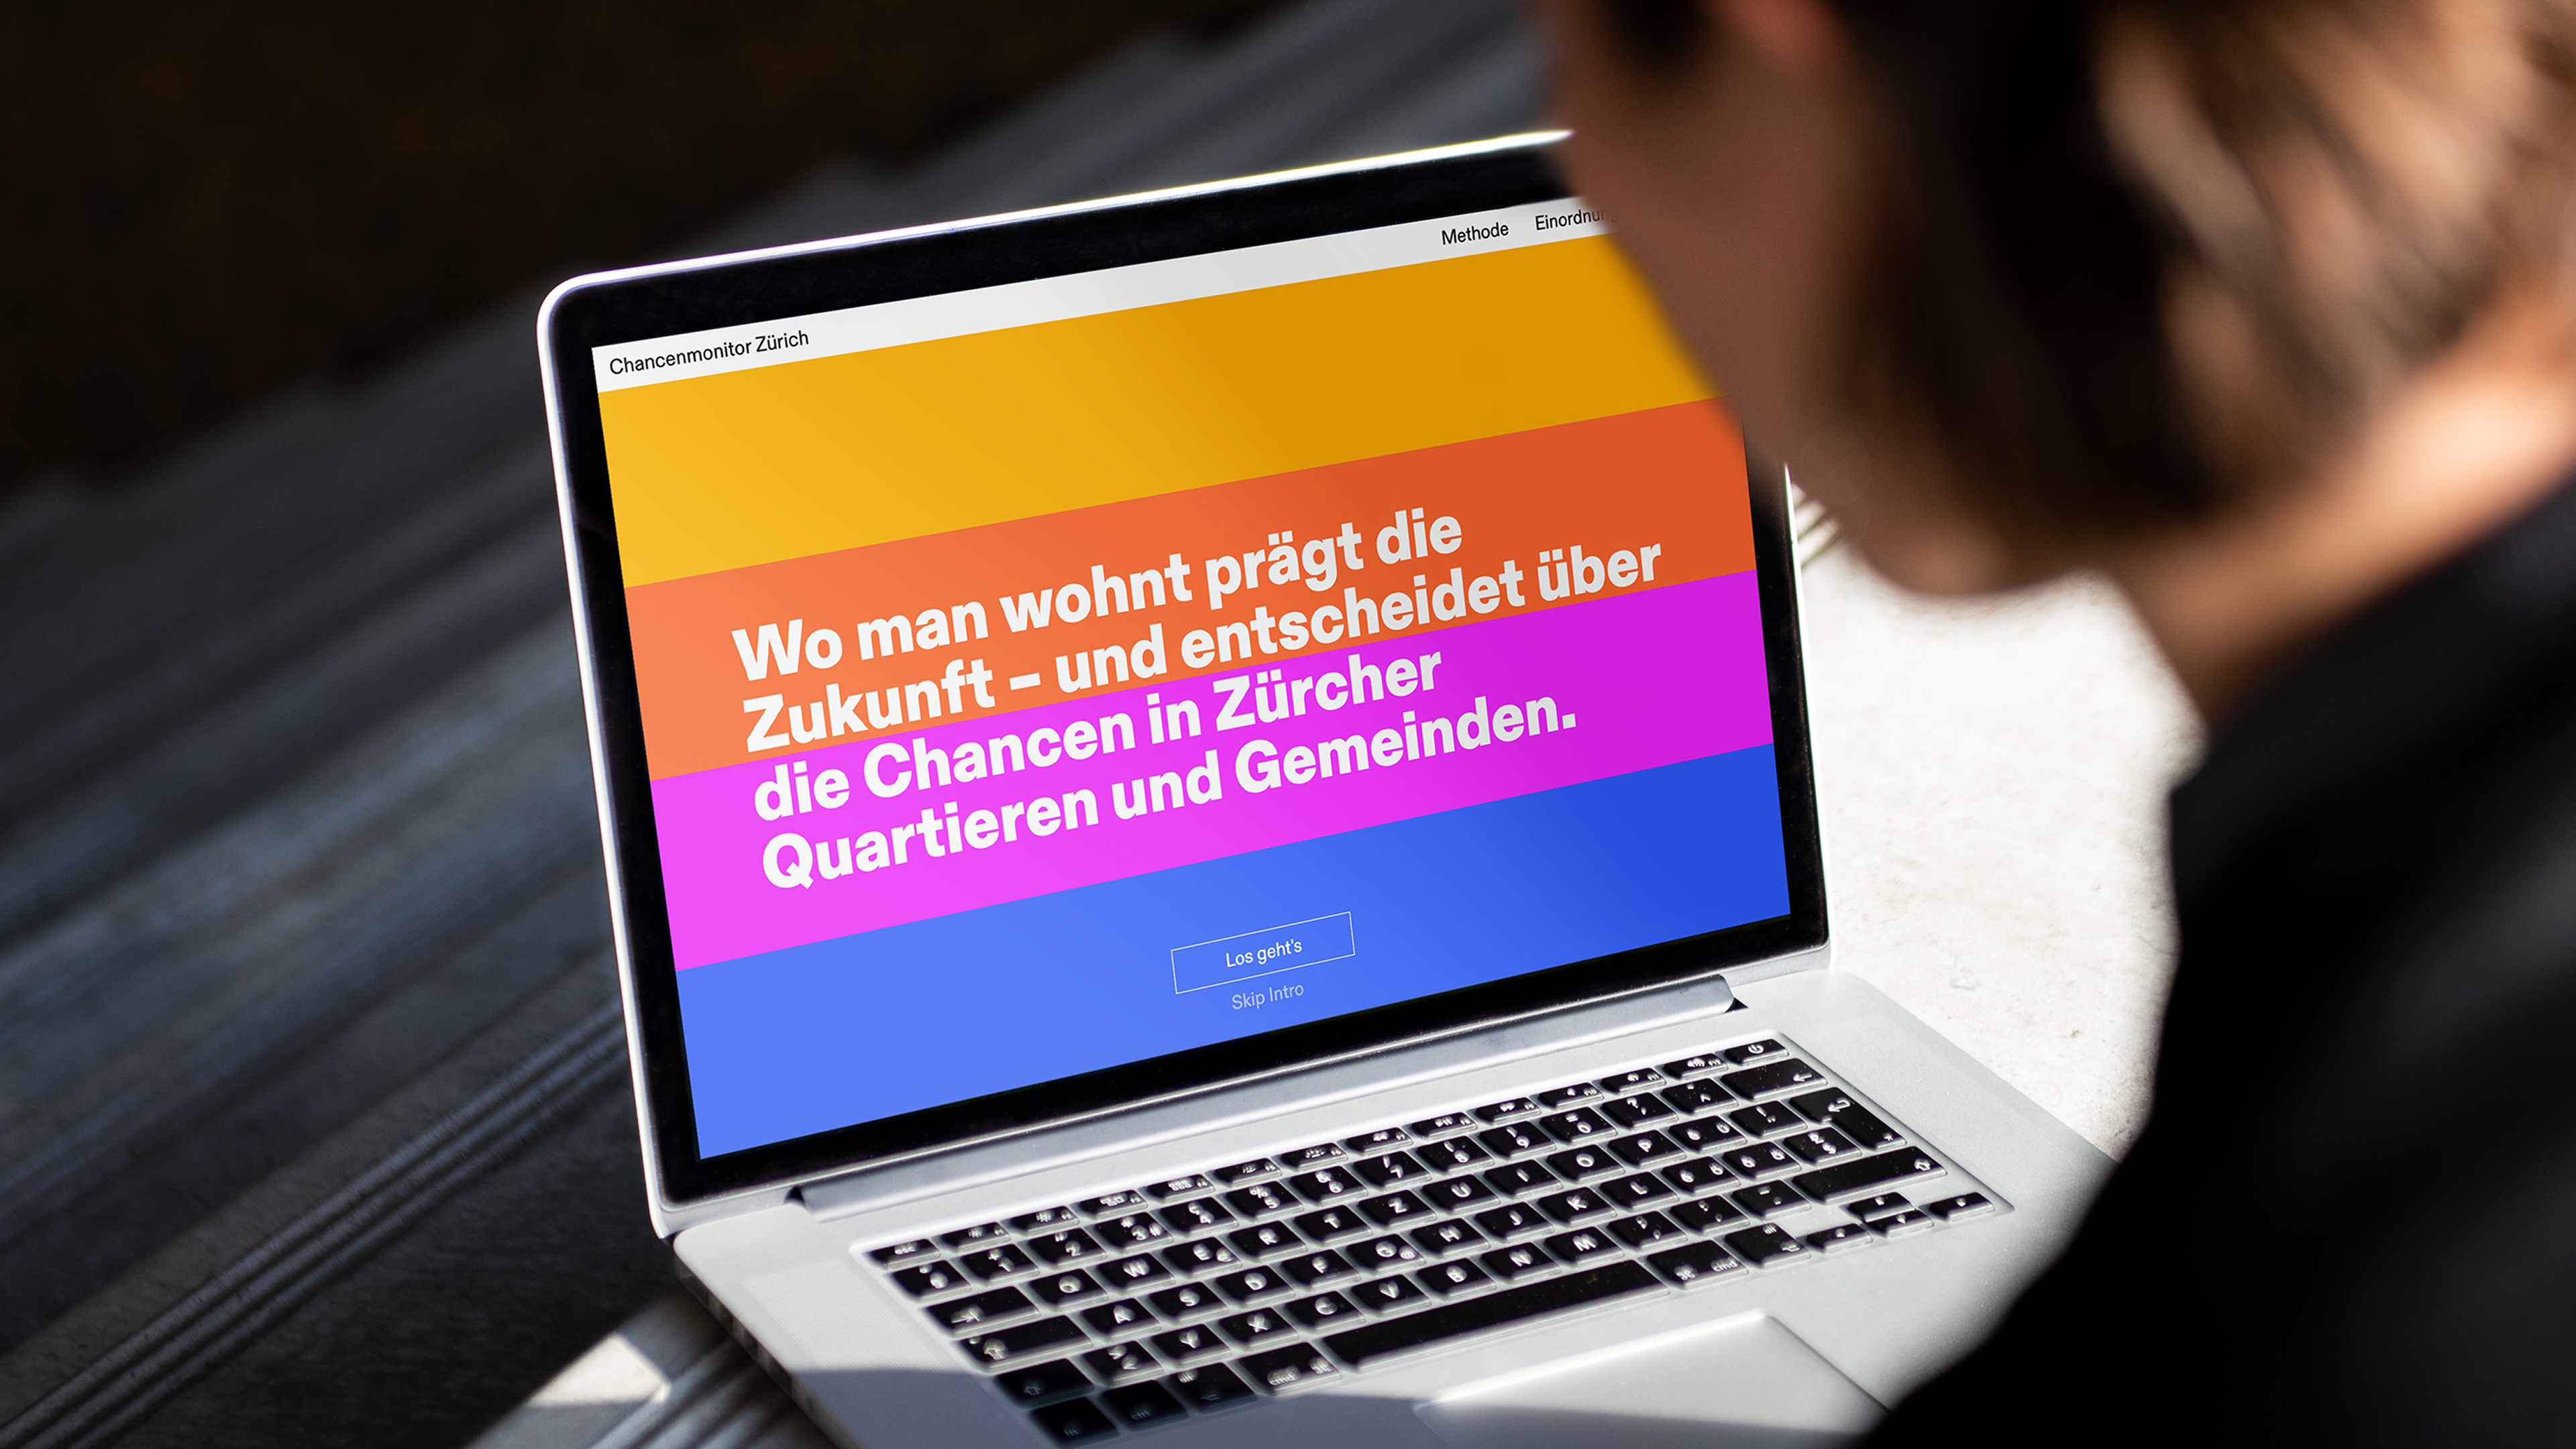
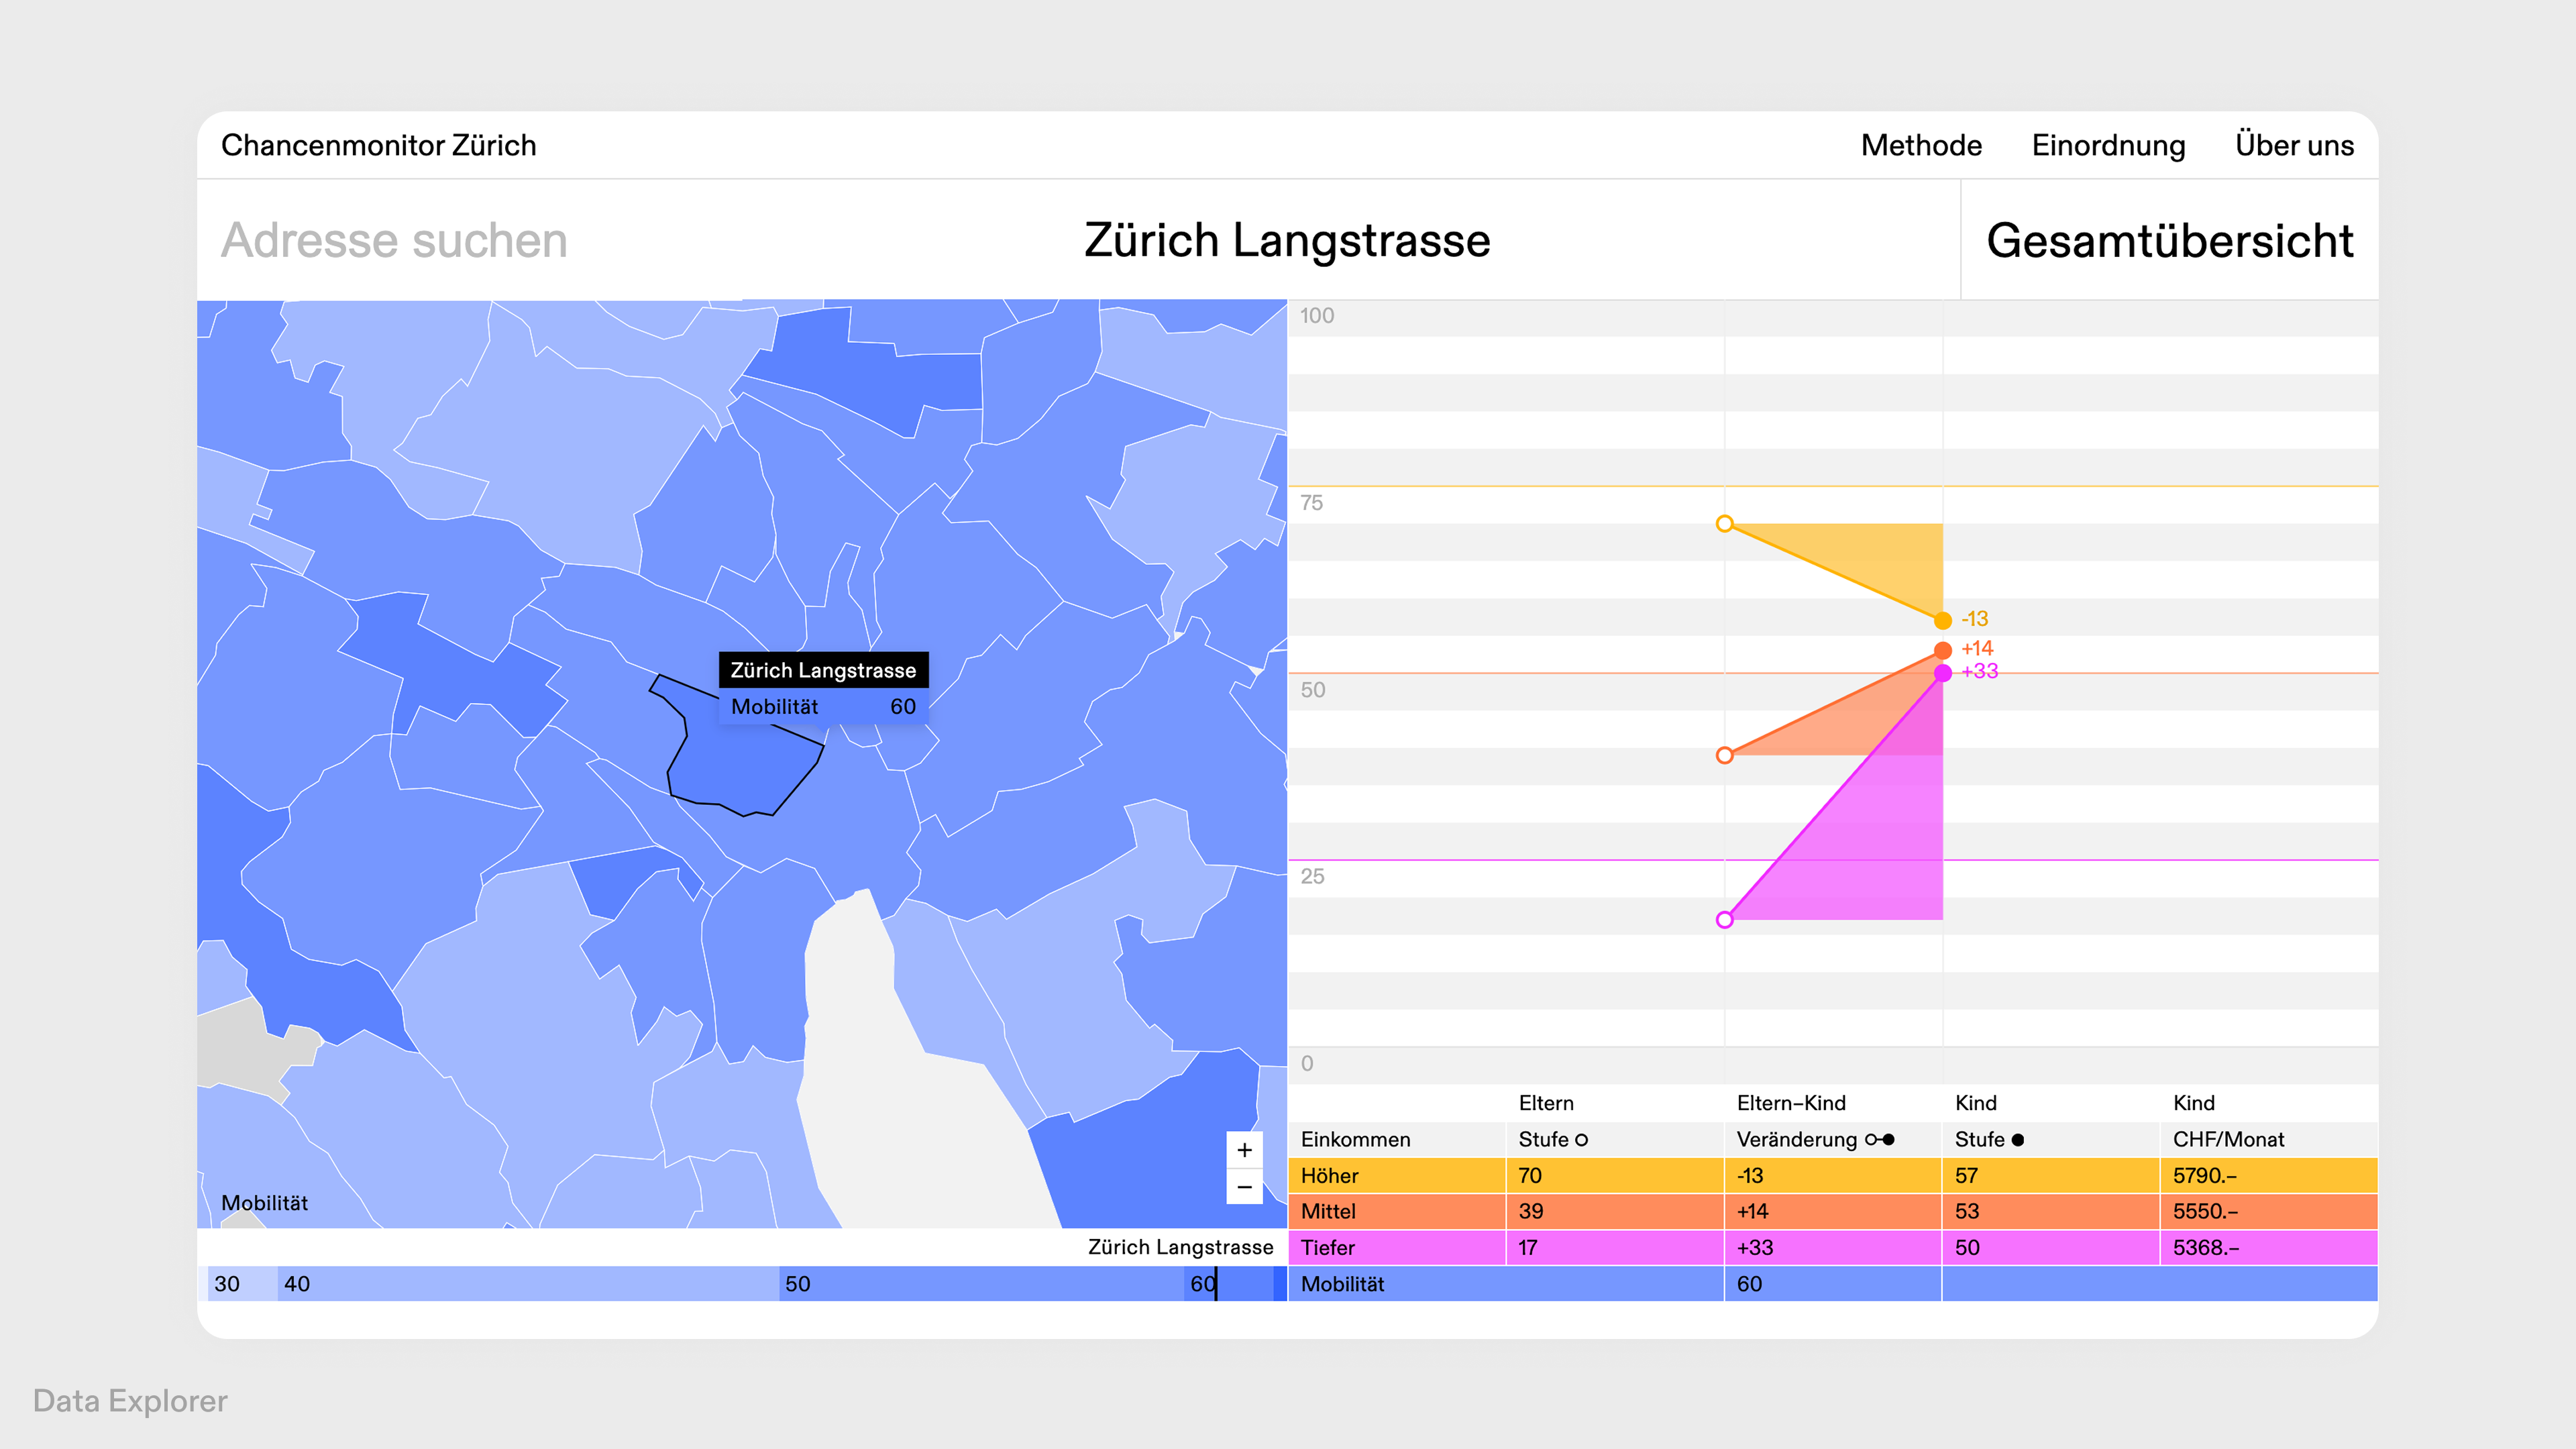
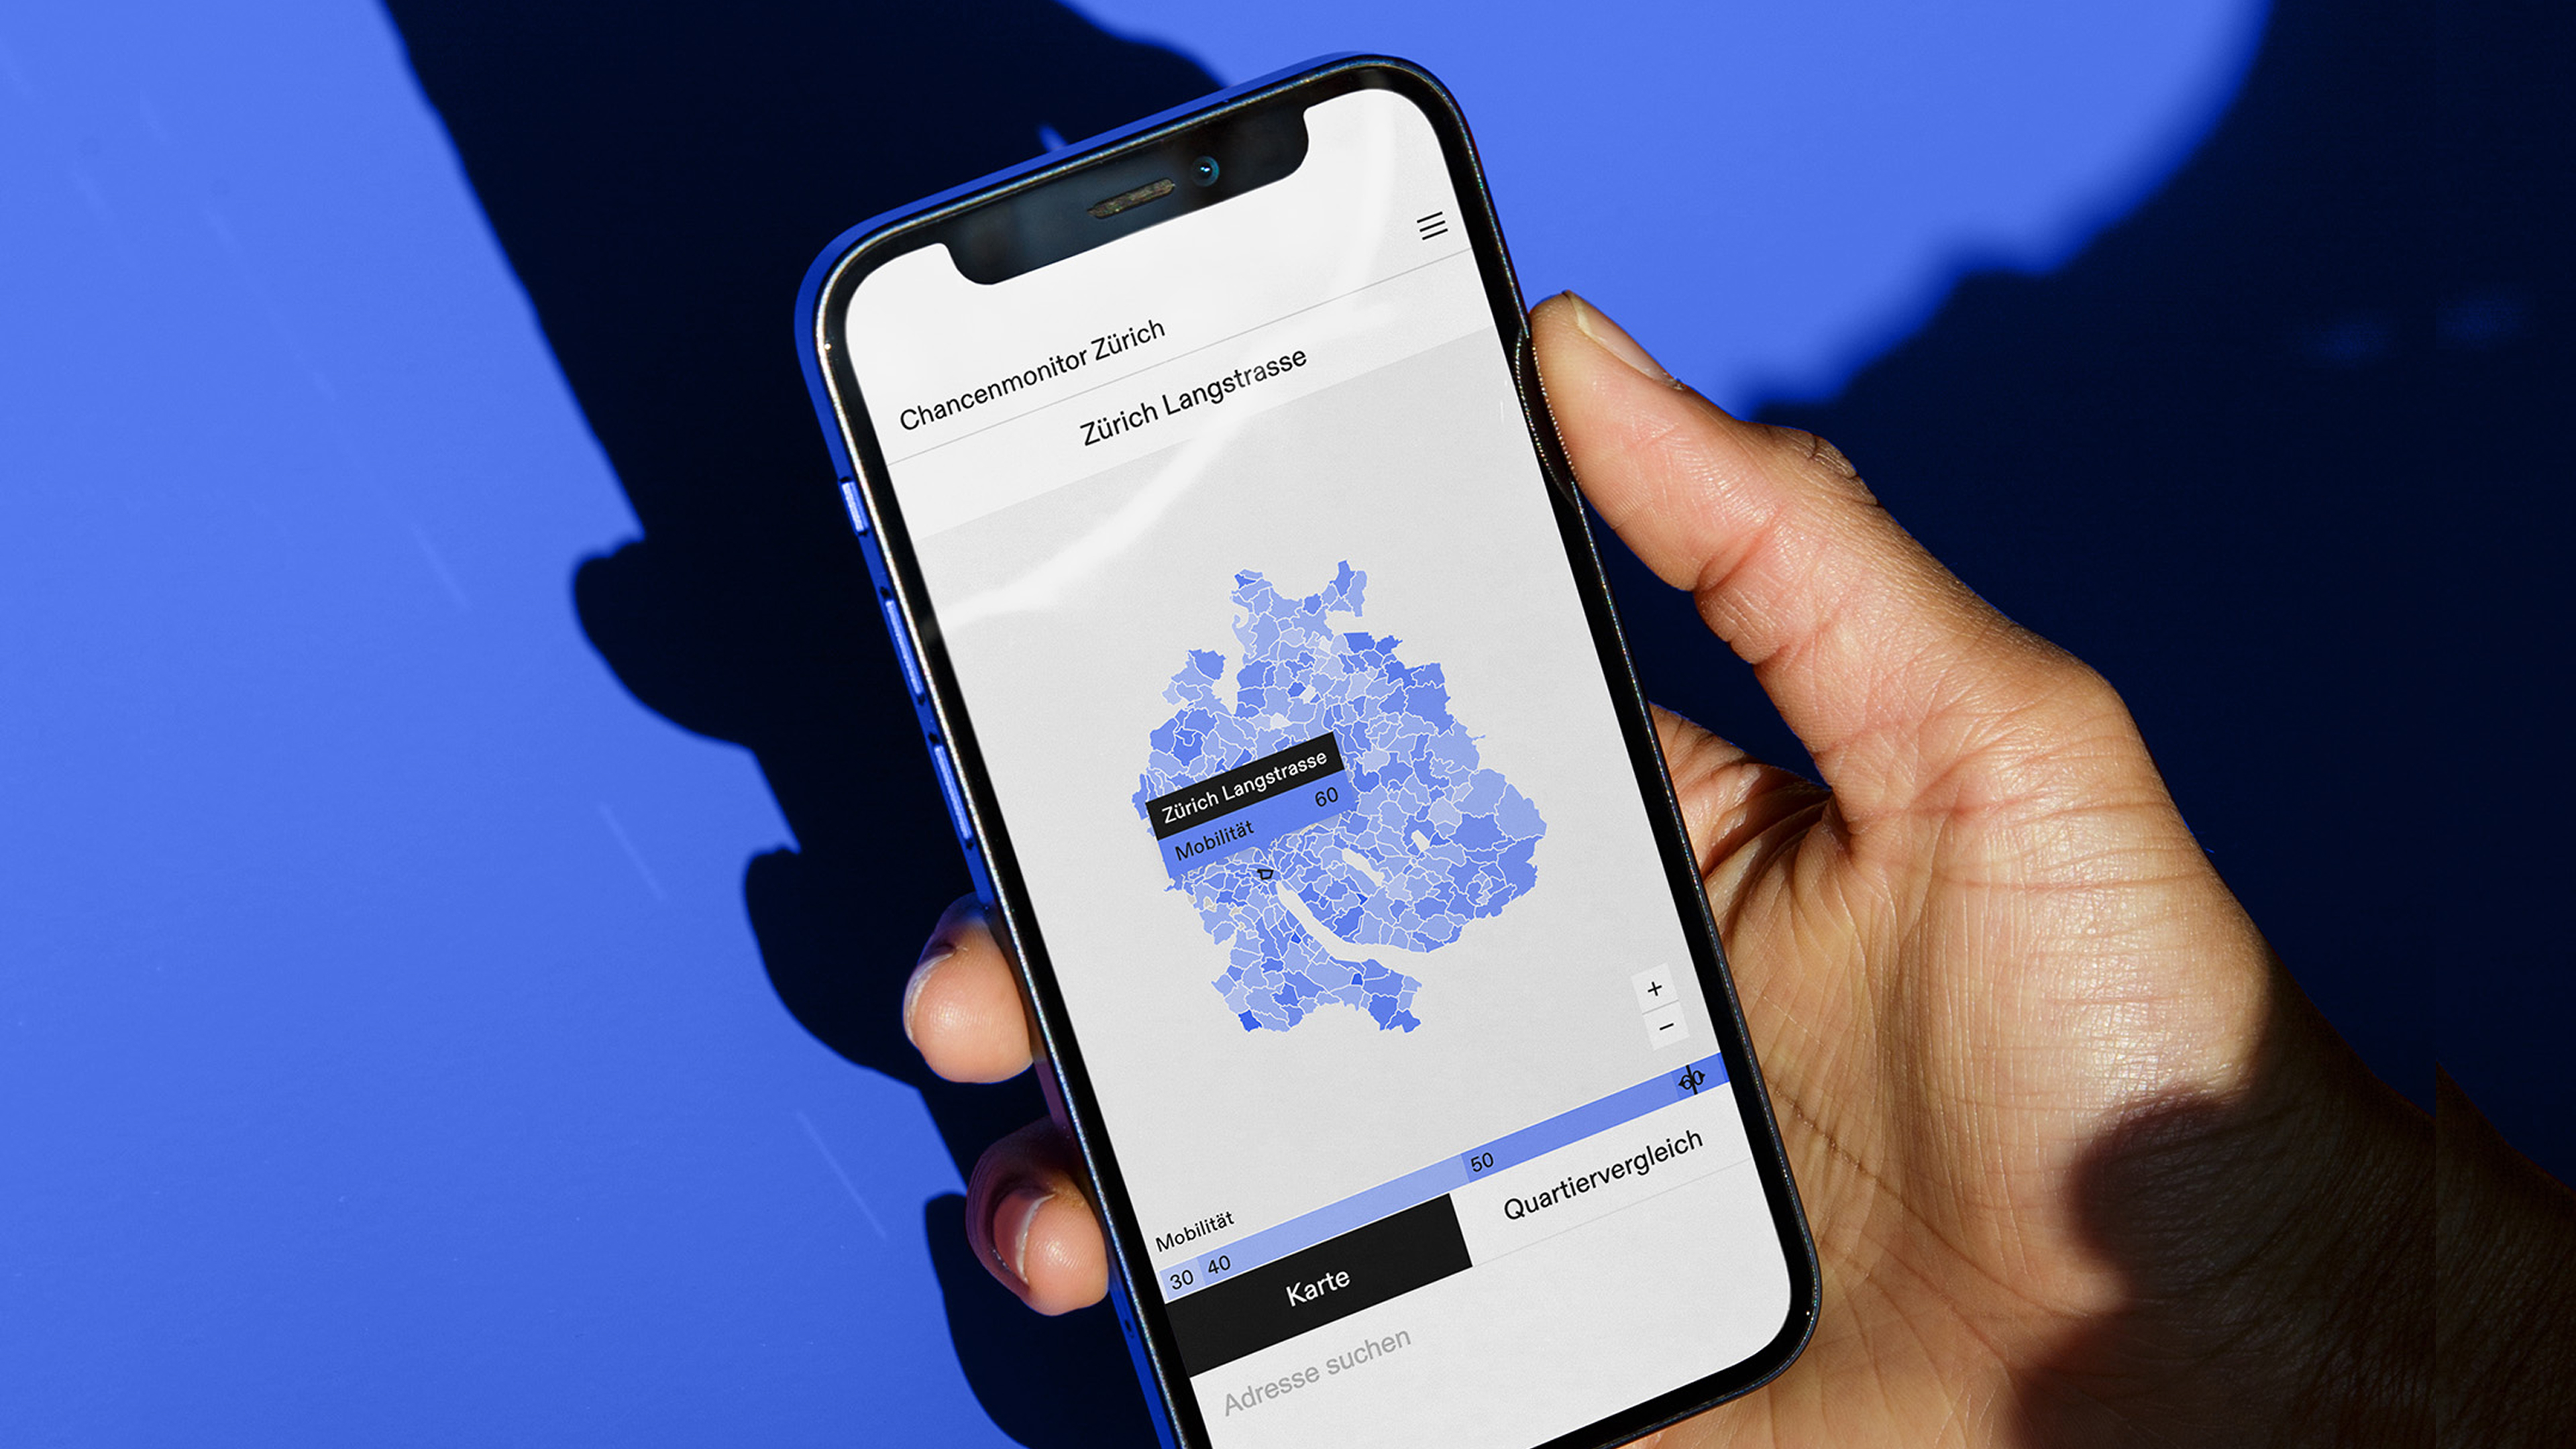
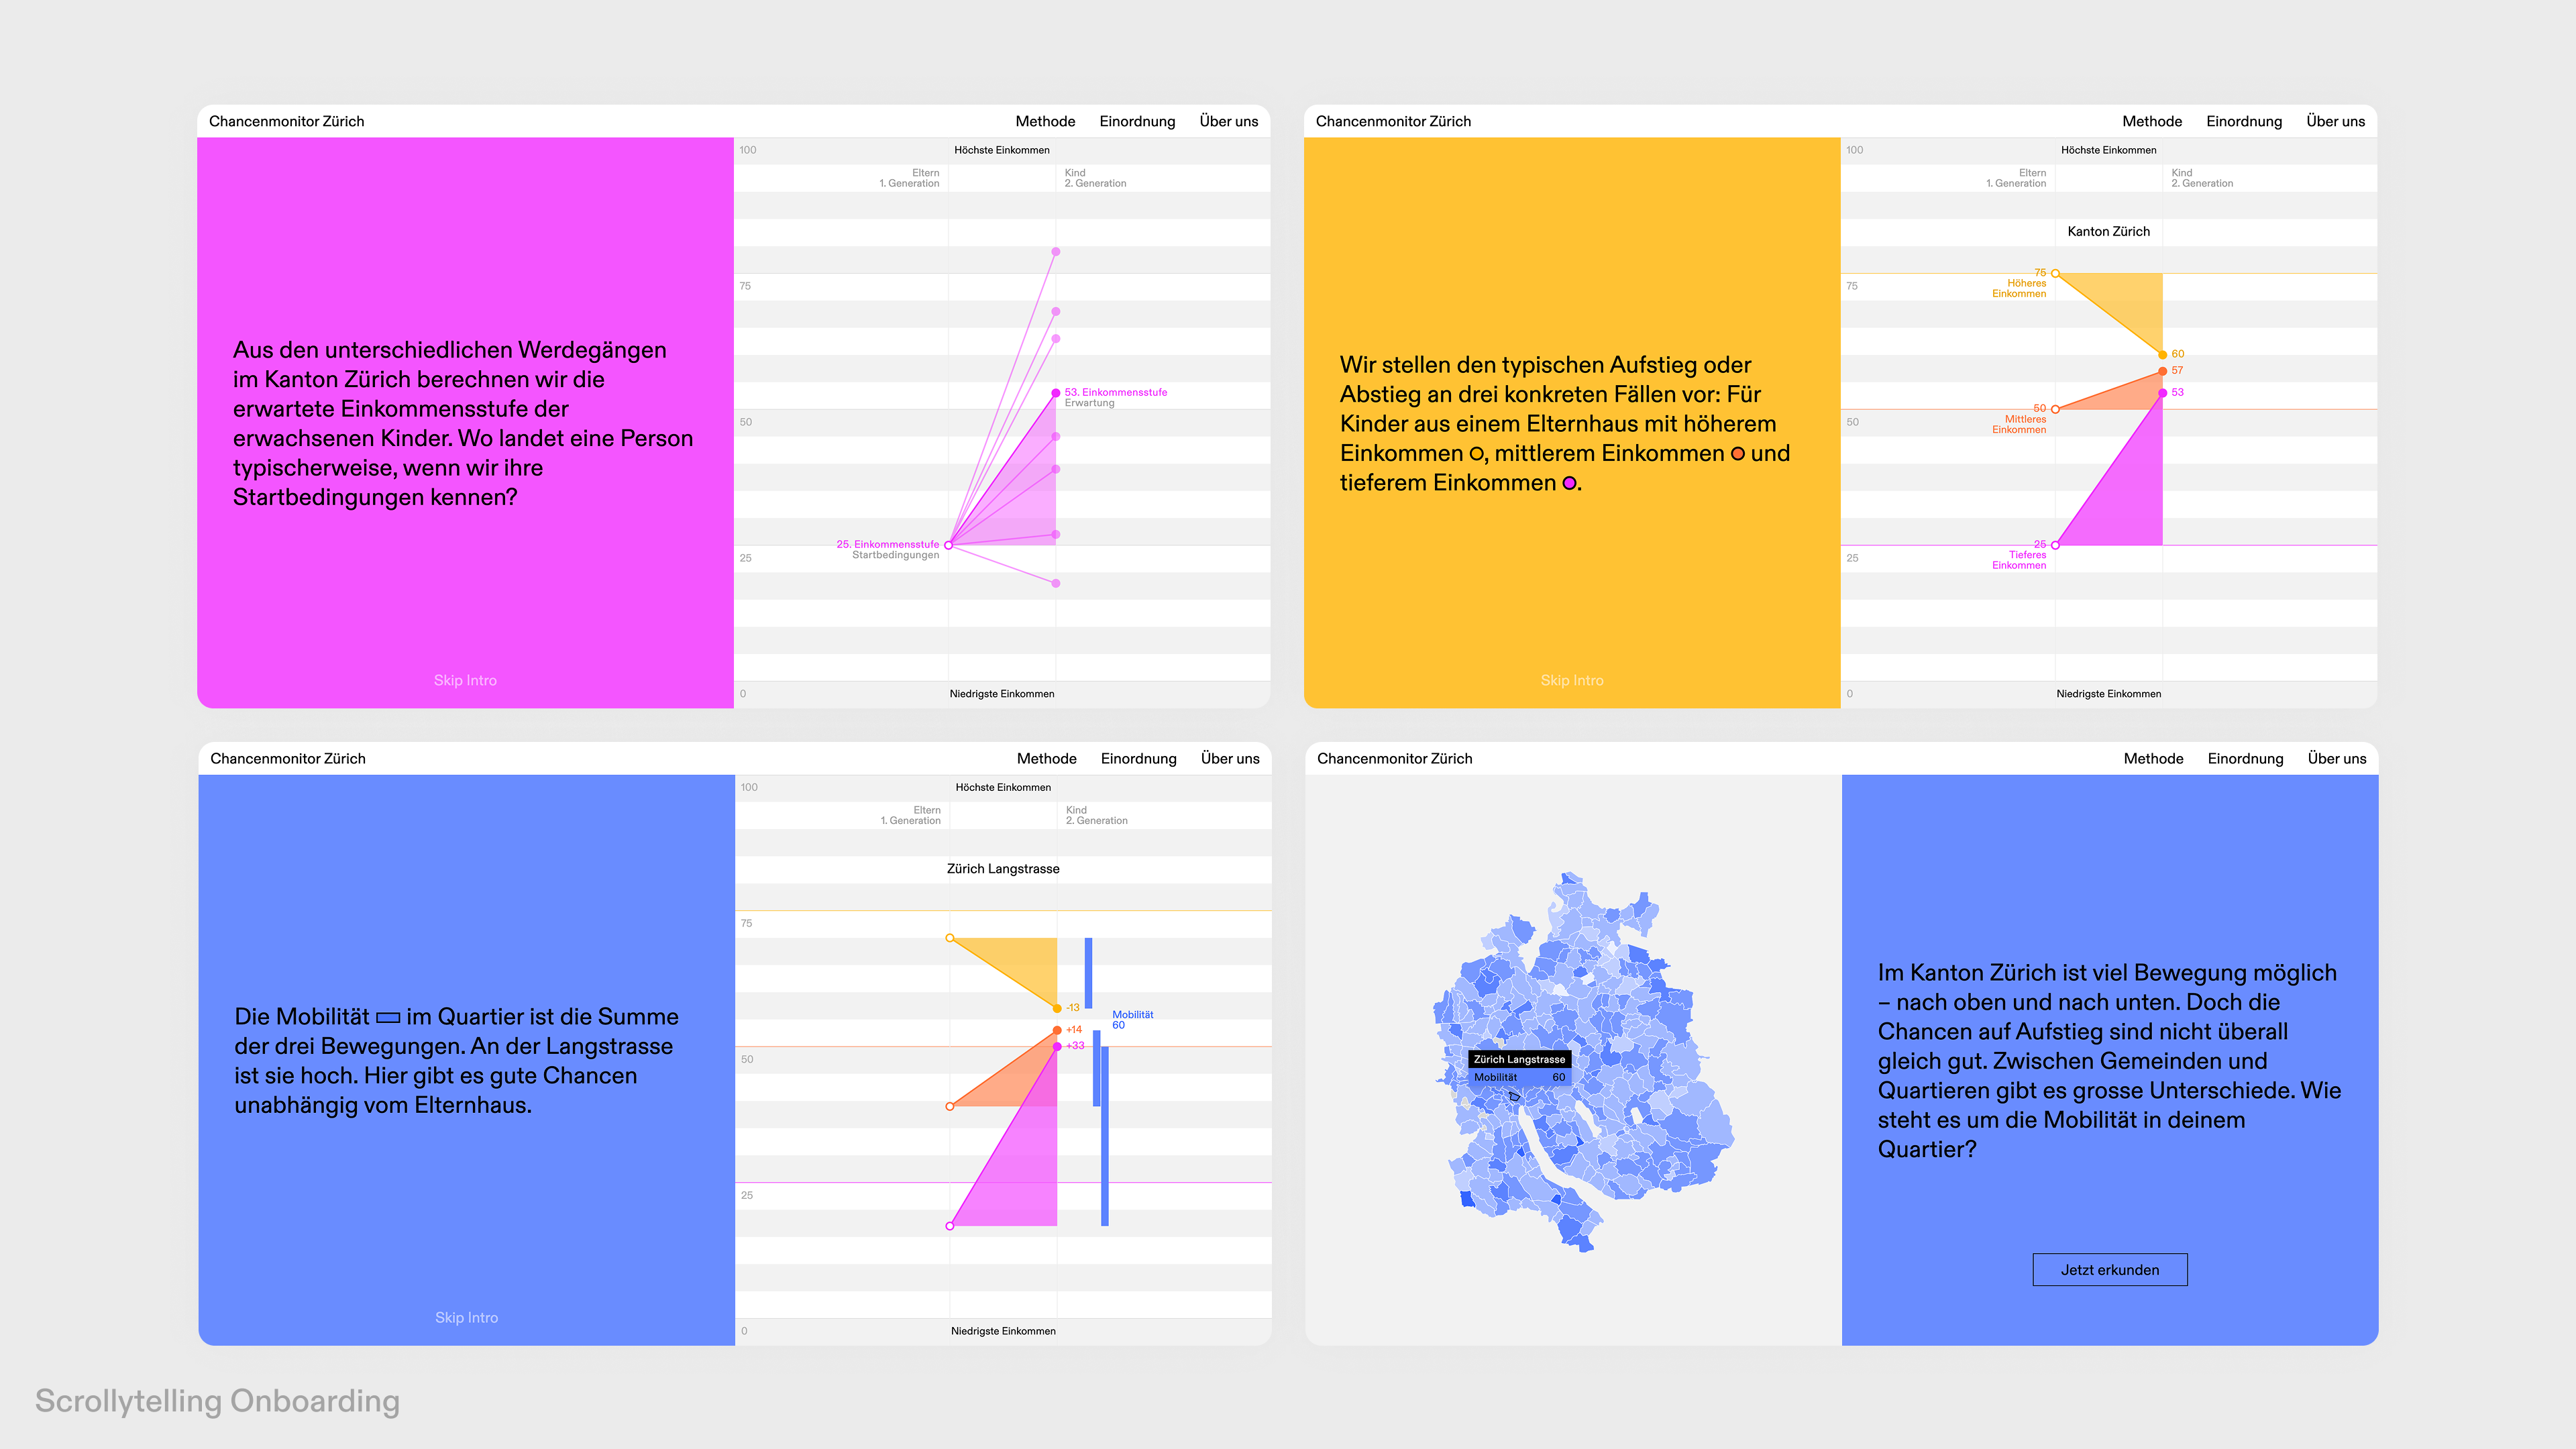
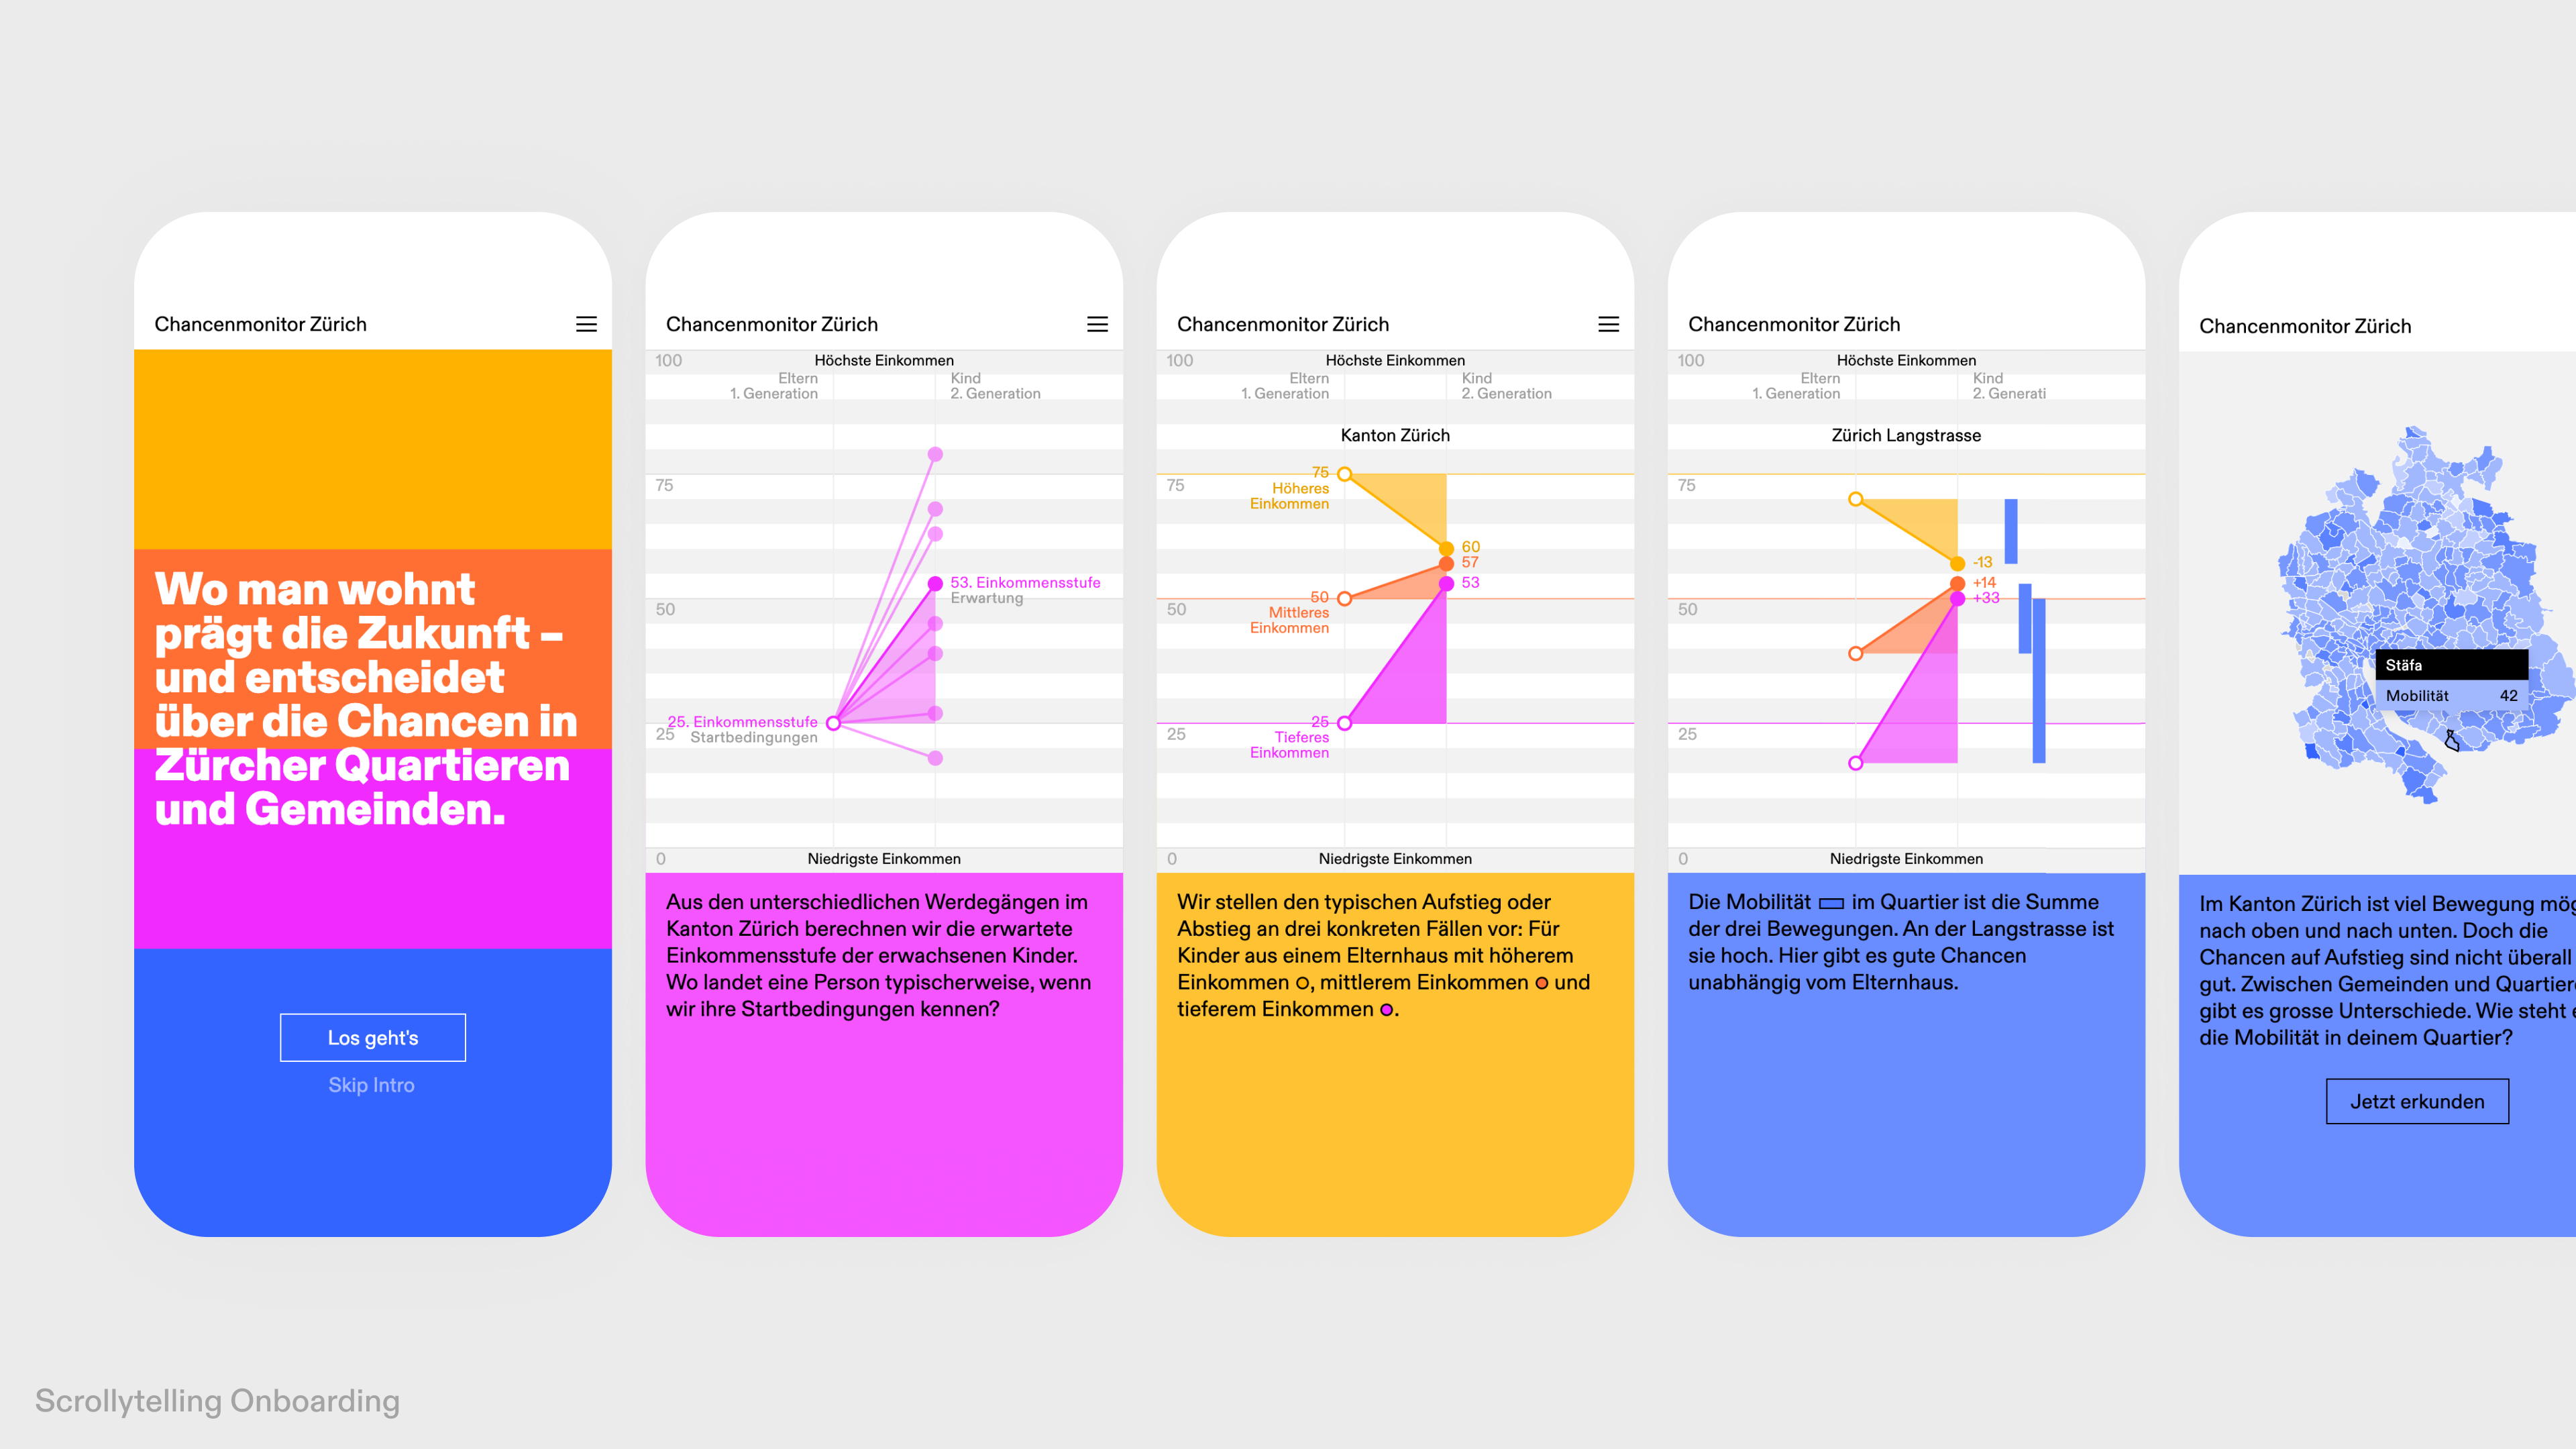
Each neighborhood receives a distinct mobility signature expressed through its three slope configuration. The mobile friendly web application introduces the method through scrollytelling onboarding that uses the same visual language as the explorer and transitions seamlessly into the interactive environment. This continuity builds understanding gradually and supports intuitive navigation. The explorer connects overview, comparison, and neighborhood detail levels. A split screen interface combines geographic orientation with analytical comparison while preserving spatial context. A consistent color and terminology system reinforces recognition across views. Users explore neighborhoods through an interactive map or direct search. A comparison mode presents all neighborhoods as small multiples and reveals regional mobility patterns.
Relevance
The Opportunity Monitor demonstrates how design can connect academic research with public access to structured knowledge. The platform enables broad audiences to understand how neighborhoods influence economic opportunity and supports informed discussions in education, urban development, and social policy. The project shows how information design can transform complex scientific research into accessible public knowledge.
Credits